Tag: tempdb

Tempdb growth due to Version Store in AlwaysOn

<<Previous

This article about fixing tempdb growth due to Version Store in Always On Secondary replica. This is in continuation of  the article Tempdb space issue in AlwaysOn Secondary Replica. Hence please go through the first article and then comeback here so that it make more sense to you.

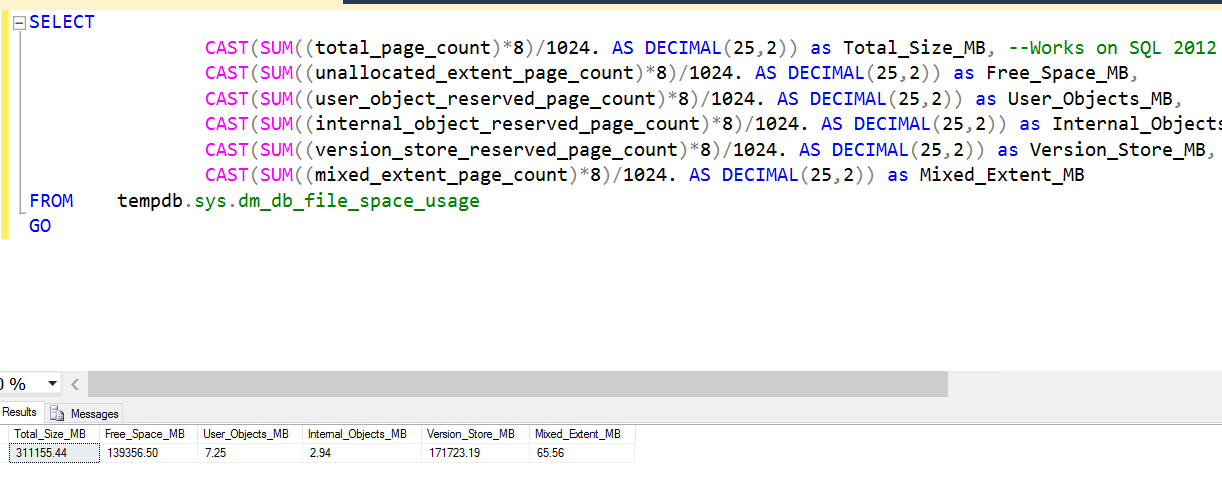
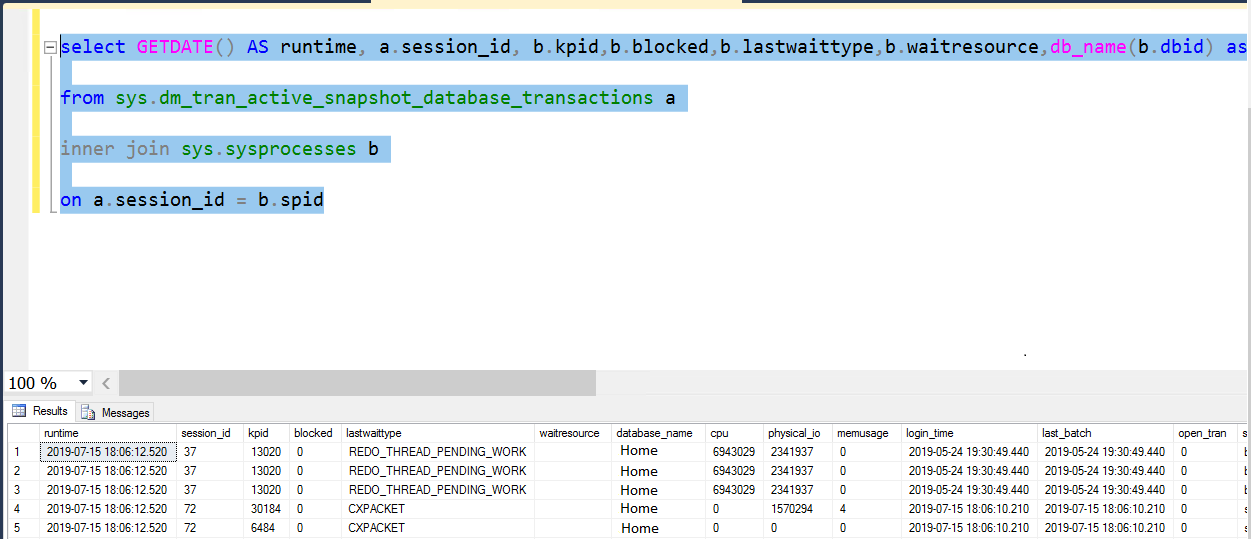
To summarize till now we have found that version store is consuming most of the space in tempdb. Hence we tried to find out the transaction consuming version store and detected an old system session id having lastwaittype as “REDO_THREAD_PENDING_WORK”.

As I mentioned in the first article this is a hint of some transaction in primary causing this. Furthermore you can check the below performance counters:

  • Longest transaction that’s currently running: SQLServer:Transactions\Longest Transaction Running Time.
  • The current size of all the version stores: SQLServer:Transactions\Version Store Size (KB) .
  • Rate of version store cleanup in tempdb: SQLServer:Transactions\Version Cleanup rate (KB/s).
  • Rate of version store generation: SQLServer:Transactions\Version Generation rate (KB/s).

Conversely you can use the below query in secondary replica facing the issue.

Query to check the above mentioned performance counters
SELECT * FROM sys.dm_os_performance_counters WHERE counter_name IN ( 'Longest Transaction Running Time' ,'Version Store Size (KB)' ,'Version Cleanup rate (KB/s)' ,'Version Generation rate (KB/s)' )
Sample output:
Result set of Longest Running Transaction
Fig1: Longest Running Transaction time

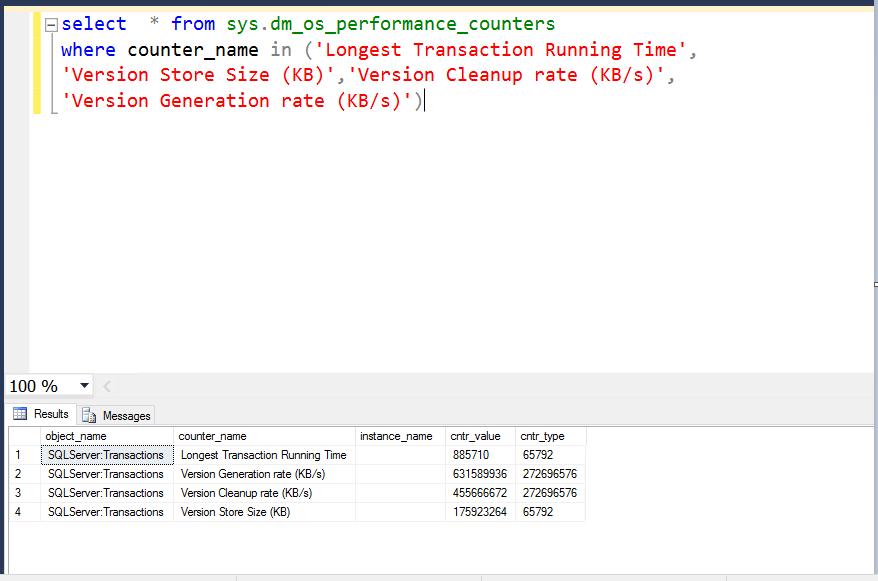
As you can see the “Longest Transaction Running Time” counter has a very high Cntr_Value. This is another key point and compelling evidence that there is long running transaction in primary replica.
Additionally the other three counters related to Version store shows that the the long running transaction is consuming the version store.

Now execute the below query again. This time in Primary Replica.

Query to find the transaction utilizing version store:
SELECT GETDATE() AS runtime
	,a.*
	,b.kpid
	,b.blocked
	,b.lastwaittype
	,b.waitresource
	,db_name(b.dbid) AS database_name
	,b.cpu
	,b.physical_io
	,b.memusage
	,b.login_time
	,b.last_batch
	,b.open_tran
	,b.STATUS
	,b.hostname
	,b.program_name
	,b.cmd
	,b.loginame
	,request_id
FROM sys.dm_tran_active_snapshot_database_transactions a
INNER JOIN sys.sysprocesses b ON a.session_id = b.spid
Sample Output:
Transactions In Primary Using Version Store In Secondary Replica
Fig2: Transactions In Primary Using Version Store In Secondary Replica

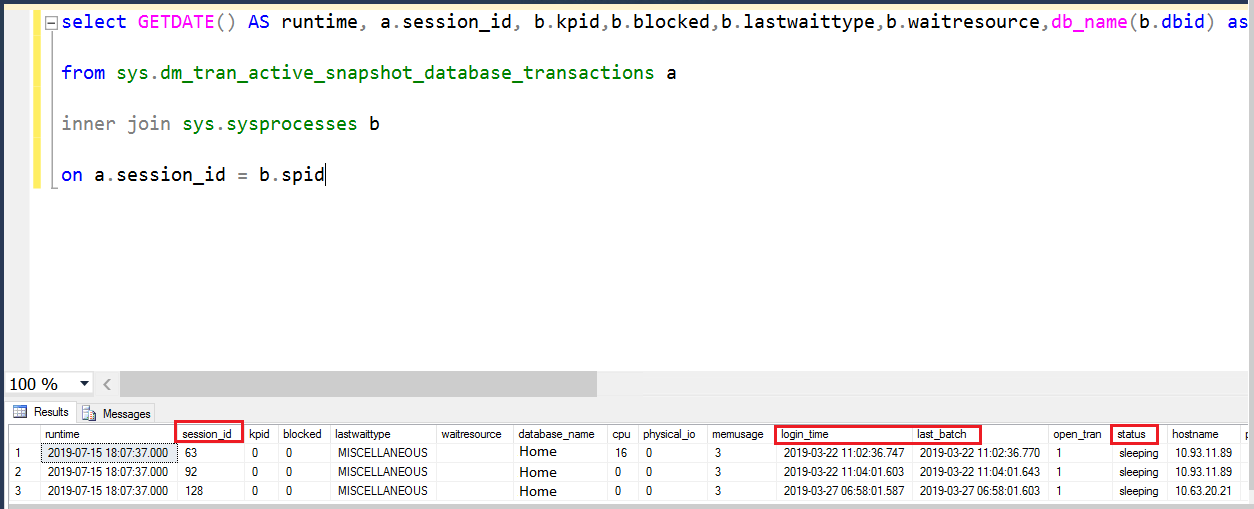
In the above sample output the most important columns are marked in red. If you have noticed, the “login_time and “last_batch” time is very old. Additionally the status is “sleeping”. Now you need to kill the corresponding session ids one by one and monitor the version store utilization as shown in the first article.

Points often overlooked is to kill one session at a time and then monitor the version store utilization in secondary replica. The reason behind this is, next time the version clean up process runs it will be able to clear the version store if you have killed the right one. This way you will be able to find the culprit transaction as well.
Also not to mention that you may need to contact the application team before killing any spid depending upon your environment.

Hope this helps. If you find any new scenario please put that in the comment section.

{ Add a Comment }

Tempdb space issue in AlwaysOn Secondary Replica

In this article I am going to discuss about how to troubleshoot and fix the tempdb space issue in AlwaysOn Secondary Replica.
Recently I had faced an issue when tempdb in AlwaysOn secondary replica had grown to the disk space limit. It was SQL Server 2014 Enterprise Edition.
As you all know tempdb is used by server operations in a SQL Instance to store the following objects:
user objects, internal objects, and the version store, used primarily for snapshot isolation. Therefore we start the troubleshooting just like we do in case of regular tempdb space issue.

First of all we need to check what is consuming space in tempdb. We need to query sys.dm_db_file_space_usage which provides the details.

Query to find the tempdb space usage:
SELECT CAST(SUM((total_page_count) * 8) / 1024. AS DECIMAL(25, 2)) AS Total_Size_MB
	,--Works on SQL 2012 and future editions
	CAST(SUM((unallocated_extent_page_count) * 8) / 1024. AS DECIMAL(25, 2)) AS Free_Space_MB
	,CAST(SUM((user_object_reserved_page_count) * 8) / 1024. AS DECIMAL(25, 2)) AS User_Objects_MB
	,CAST(SUM((internal_object_reserved_page_count) * 8) / 1024. AS DECIMAL(25, 2)) AS Internal_Objects_MB
	,CAST(SUM((version_store_reserved_page_count) * 8) / 1024. AS DECIMAL(25, 2)) AS Version_Store_MB
	,CAST(SUM((mixed_extent_page_count) * 8) / 1024. AS DECIMAL(25, 2)) AS Mixed_Extent_MB
FROM tempdb.sys.dm_db_file_space_usage
GO
The output was as follows:
Tempdb Space Issue on AlwaysOn Secondary Replica
Objects consuming space in tempdb

As you can see Version Store is the highest consumer. The next step is to identify the transactions on Secondary replica maintaining an active version store. Execute the below query in secondary replica.

Query to find the transaction utilizing version store:
SELECT GETDATE() AS runtime
	,a.*
	,b.kpid
	,b.blocked
	,b.lastwaittype
	,b.waitresource
	,db_name(b.dbid) AS database_name
	,b.cpu
	,b.physical_io
	,b.memusage
	,b.login_time
	,b.last_batch
	,b.open_tran
	,b.STATUS
	,b.hostname
	,b.program_name
	,b.cmd
	,b.loginame
	,request_id
FROM sys.dm_tran_active_snapshot_database_transactions a
INNER JOIN sys.sysprocesses b ON a.session_id = b.spid
Sample Output:
Tempdb space issue on Always On Secondary Replica
Result showing transactions utilizing version store

Most important columns in the above result set to notice are “session_id “, “lastwaittype”, “database_name”, “login_time” and “last_batch”.

In addition you need to remember that we ran the query in Secondary Replica. Therefore you can see lastwaitype as “REDO_THREAD_PENDING_WORK”. Which means the redo thread was trying to catch up with the primary and was maintaining multiple versions of the rows updated to achieve read consistency.

In addition to that you can see “login_time” and “last_batch” of the session_id 37 was the oldest among all. If it is recent we can ignore but in my case it was two months back. Hence I could sense that there must my some transaction in Primary causing this.  Besides that the session_id 37 is < 50 which means it is a system session. Now let’s see how to find the culprit in primary. >>Continue Reading

{ Add a Comment }