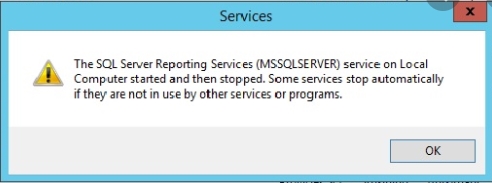
This is about a fix for the error “Event id 133 from source report server cannot be found”. This is in continuation of SQL Server Reporting Services Not Starting.
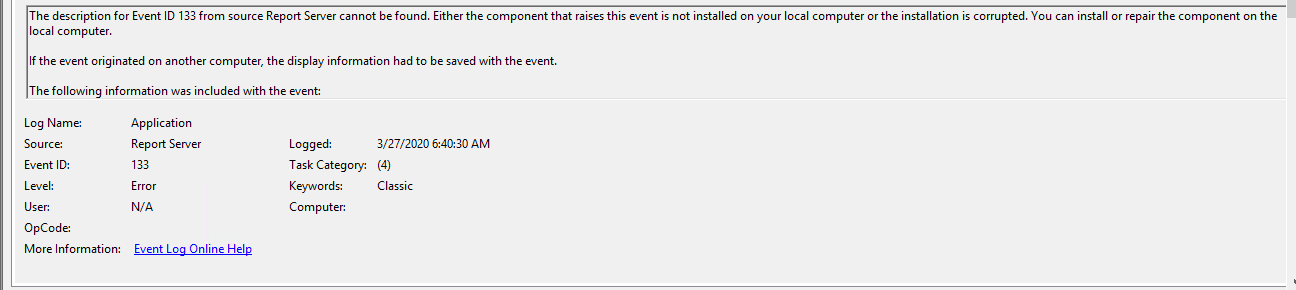
If you have landed here directly and you are getting the exact error in the Application event log, you are in right place. In summary I had explained the troubleshooting steps and showed the exact error message in the first article.
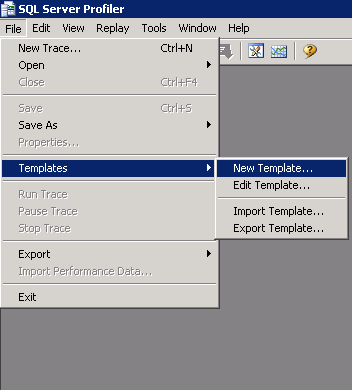
Further troubleshooting steps:
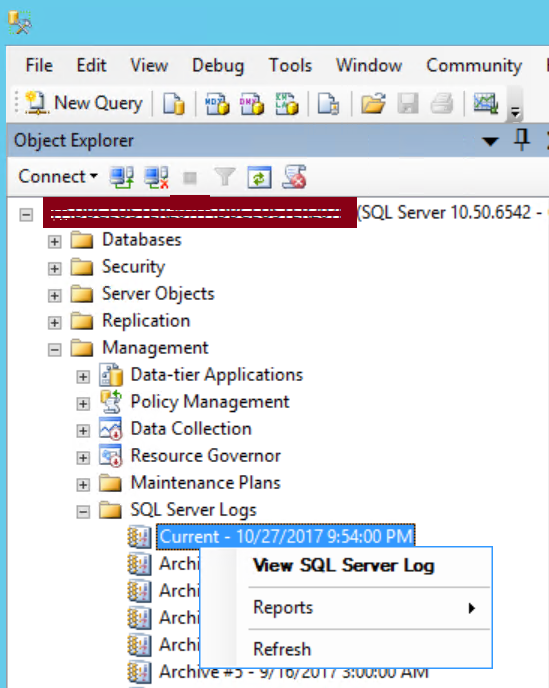
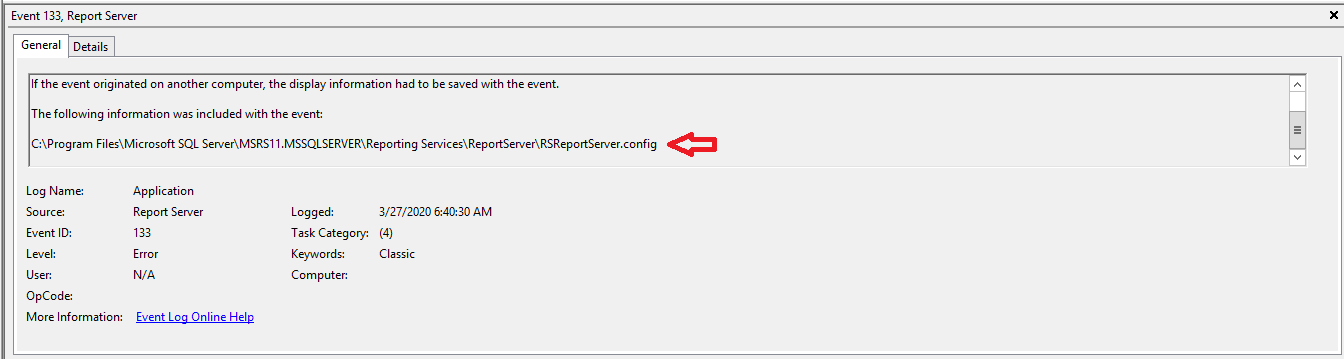
Once I had checked the Application Event log, next I checked the Reporting Services log. The location of the log files is your SSRS install directory. In case you have observed, the error in the application event log contains the install directory:
Hence you can find the SSRS logs in the following location: Considering the above example.
“C:\Program Files\Microsoft SQL Server\MSRS11.MSSQLSERVER\Reporting Services\LogFiles”
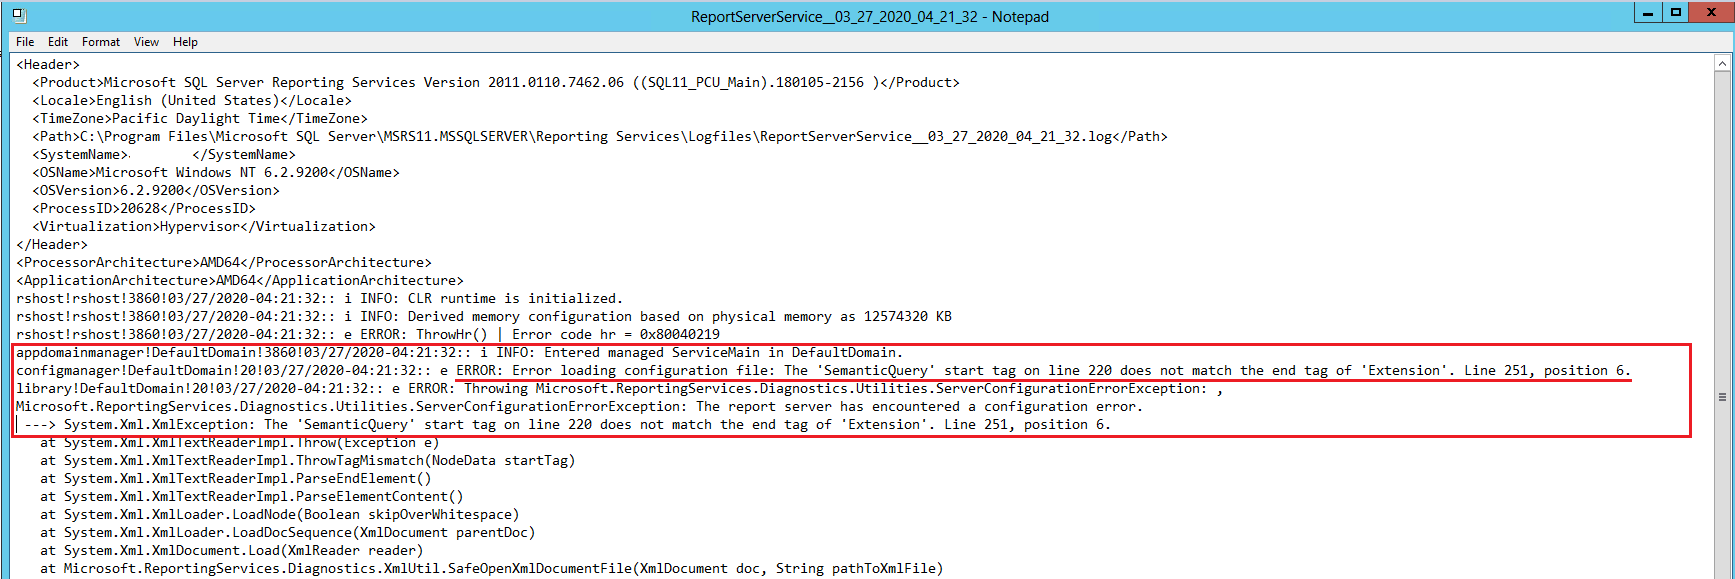
Looked at the latest log file and could find the following error message:
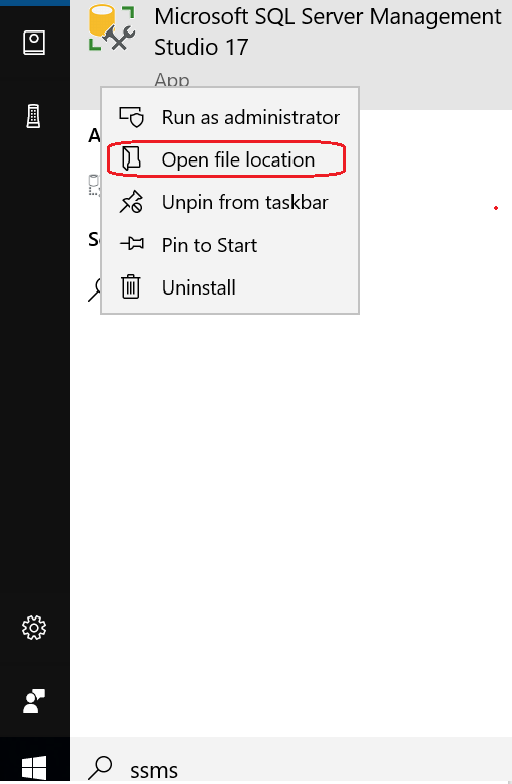
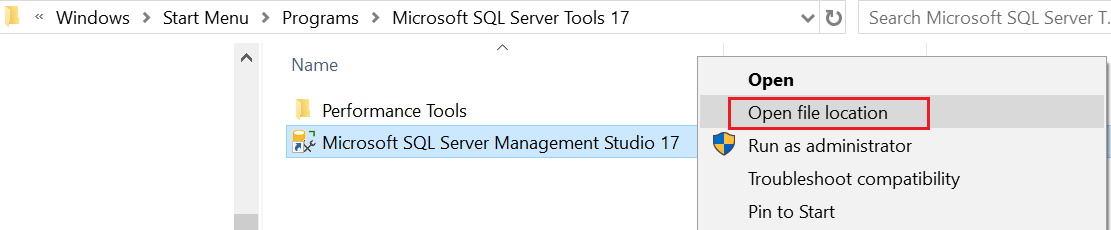
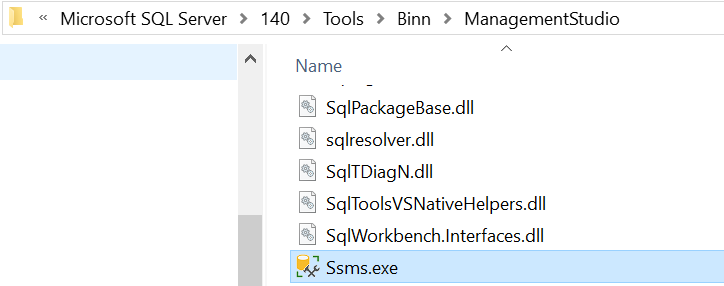
The error indicates some issues with the SSRS Config file. Refer the first screen shot in this article to find the path of the file.
“C:\Program Files\Microsoft SQL Server\MSRS11.MSSQLSERVER\Reporting Services\ReportServer\RSReportServer.config”
The most compelling evidence is the following part in the error message:
“configmanager!DefaultDomain!20!03/27/2020-04:21:32:: e ERROR: Error loading configuration file: The ‘SemanticQuery’ start tag on line 220 does not match the end tag of ‘Extension’. Line 251, position 6.”
With this in mind I opened the config file in Visual Studio and searched for “SemanticQuery” and “Extension”.
Note: Please create a copy of the original RSReportServer.config file before making any changes.
Visual Studio View of RSReportServer.config file:
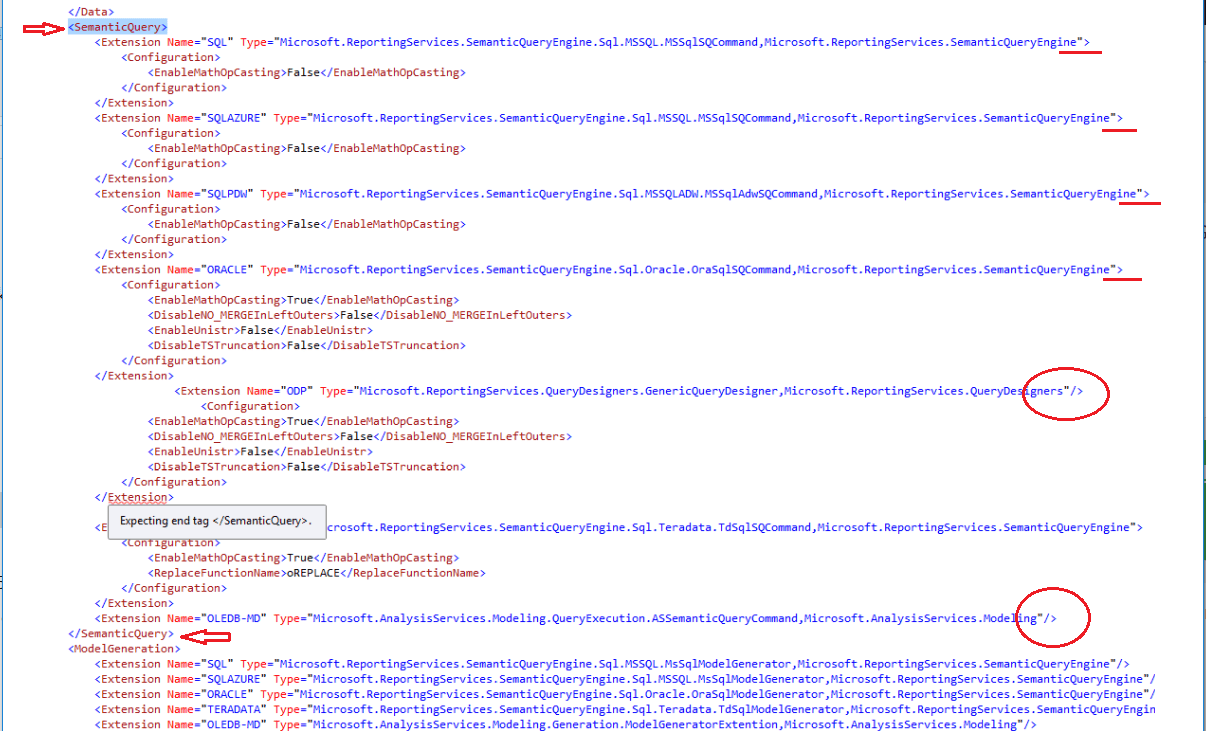
The arrow shows the <SemanticQuery> block. If you have observed, once I put the cursor in the </Extension> it showed the dialog box saying “Expecting end tag </SemanticQuery>.
The next step is to observe the difference of <Extension> blocks between “SemanticQuery” block. If you can see the red underlines does not have the ending ‘/’ except the one (second last red circle).
Where as the last <Extension> before the ending </SemanticQuery> has ‘/’. I removed the ‘/’ from the “Extension” block which was expecting end tag </SemanticQuery> and saved it.
Bingo! that worked and Reporting Services came online. This is how I fixed it, there may be multiple issues which you may need to fix.
If you have faced any other issues let me know by leaving your comments below.