You may have come across situations where SQL Server cluster instance has failed over from one node to other and you were asked to find the SQL Cluster Instance failover time and node name prior to failover.
Who can ask this question? Your approver, manager or colleague anyone can ask you for different reasons, to know since when the instance is running on wrong/passive node, what alert system you have and it worked properly or not etc.
Whatever may be the reason, you want to find it quickly. In this article I am going to explain how to find the required information from SQL error log.
You need to search for the messages containing the text NETBIOS in the error log files.
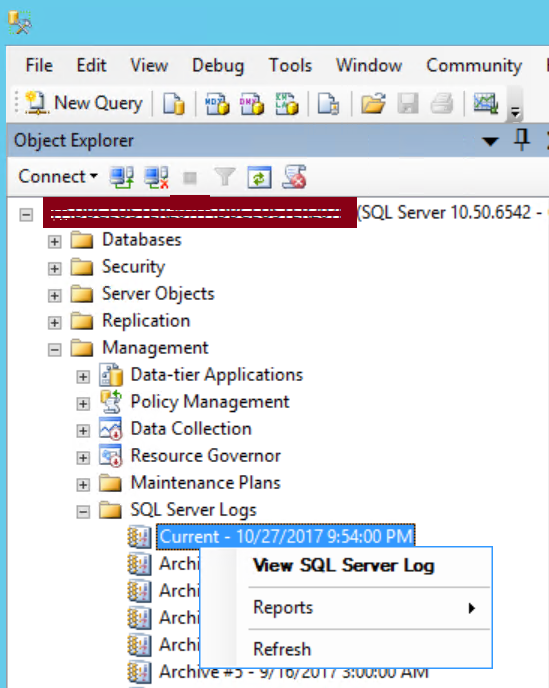
Launch SSMS (SQL Server Management Studio) and start with the first error log to view as shown below:

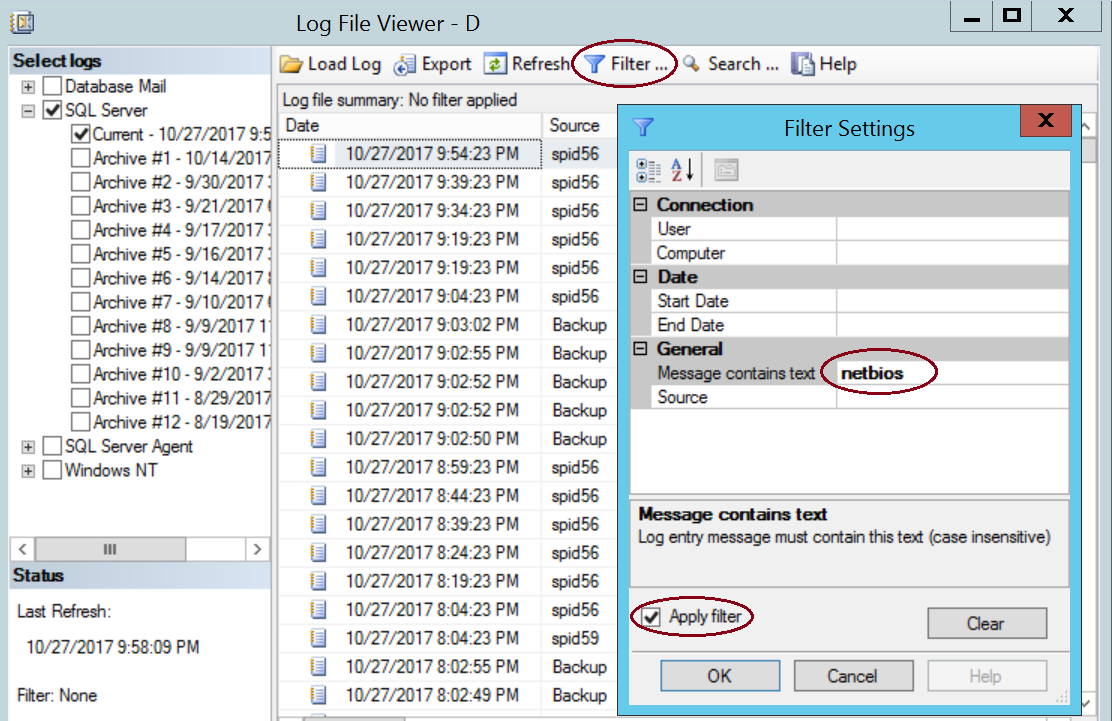
Click on Filter and type in “netbios” against the field “Message Contains Text”. Mark the check box for Apply filter and click on OK as shown below. The message you are searching for, can be typed in Capital/Lower case.

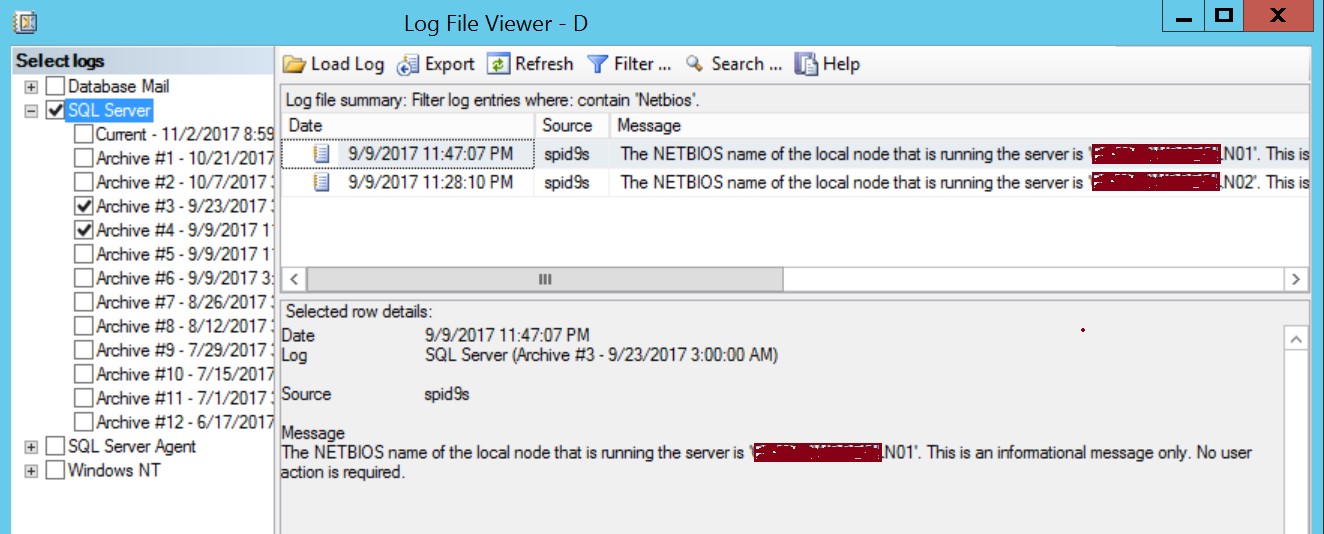
Start checking each error logs until you find the required information as shown in the following screen shot.

The Message is like:
“The NETBIOS name of the local node that is running the server is ‘NodeName’. This is an informational message only. No user action is required.”
The message provides the information about the current Node, hosting the SQL Server Instance and the time it came up on the Node. Hence you need to keep checking the prior error logs which will show a different Node name and time in case it failed over from other node.
In the above example it shows the particular SQL Instance was running on Node “N02” prior to the failover.
The following information you can find using the NETBIOS filter:
- What is the current node? (N01)
- Is failover happened? Yes, as it shows a different node (N02) in prior error log file.
- Which node it was running prior to failover?(N02)
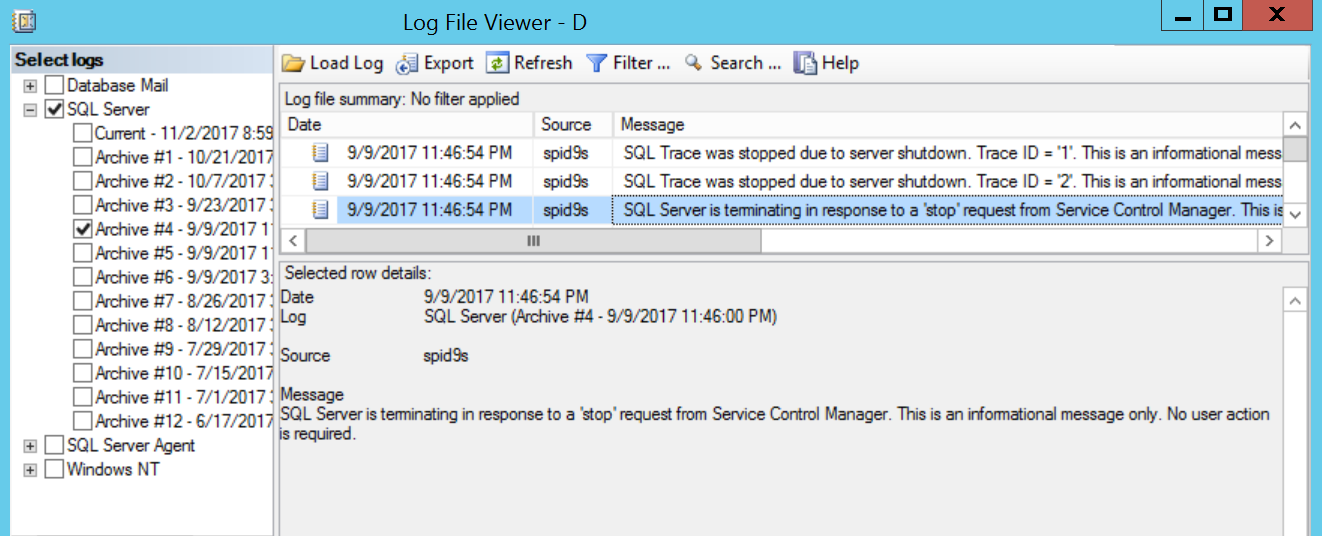
- What time failover started (Between 9/9/2017 11:28:10 PM the instance was on N02 and 9/9/2017 11:47:07 PM the instance started on No1. Check the error log around the time removing the filter and you will be able to find the exact time as shown in the below screen shot.)

You can also find what time SQL Instance came online/ what is the last SQL restart time. Of course you can find it from tempdb creation time? (Date 9/9/2017 11:47:07 PM the instance started on No1).
Hope this helps and I would like to hear from you if you have any other ways to find the same information quickly.
You may also want to check the following articles:
Myth around Remote Query Timeout Option
All Logins got disabled due to trigger execution